SALES COMMENTARY
Sales reached 7,531 on TRREB for April. This number was 5.2% lower than April of 2022 but 9.3% higher than March. We will start again to compare year-over-year numbers. Why? From April of 2022 onwards, when markets corrected, real estate markets have now become comparable. For sales in May, you can be certain that 2023 will be bigger than for 2022.While sales have been increasing, they are nowhere near the levels of previous years. In fact, our best guess is 75- 80,000 sales for the year. This is at the level of sales in 2002 when the GTA was 26% smaller in terms of population. The primary cause is not a lack of buyers but a lack of listings.
There are two reasons. First, history shows that homeowners will do anything to keep their home. They will miss payments on cars and everything else. That is why ‘power of sale’ listings are still low. Secondly, investors have little reason to sell. If the property has positive cash flow, and most properties purchased a few years ago do; then why would they sell and pay capital gains tax? In the U.S., there are rollover provisions that if you sell and then buy in the same asset class, there is no tax until you dispose of the last property in that class. If we had that rule in Canada, you would see investors sell a lot more properties and that would increase the supply to the overall market.
Why Are Prices Rising Faster Than Sales?
Why Are Prices Rising Faster Than Sales?
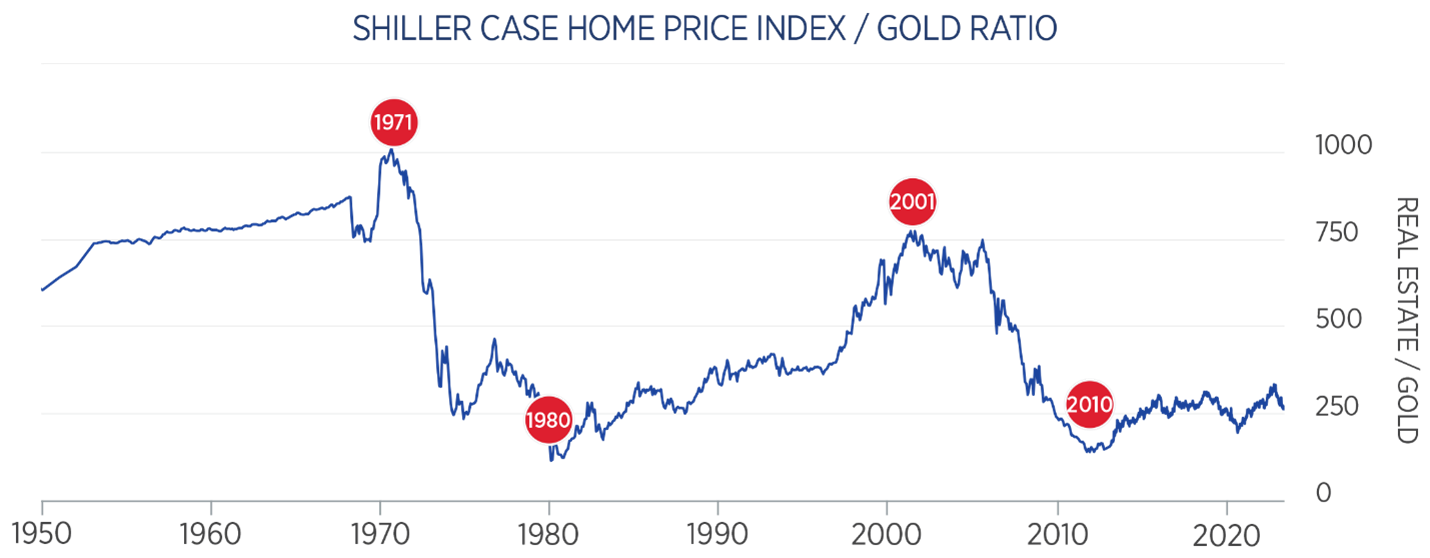
Even with higher mortgage rates, buyers (in many cases with family help) are entering the market and are prepared to pay higher prices. People are fast realizing that you need hard assets and not paper money to prepare for the future. Your principal residence is the last ‘tax free’ asset you can own.

The real estate to gold ratio measures the amount of gold it takes to buy a single family house. Based on the pioneering research of Robert J. Shiller and Karl E. Case, the Case-Shiller Home Price Index is generally considered the leading measure of U.S. residential real estate pricesSource: longtermtrends.net

The real estate to gold ratio measures the amount of gold it takes to buy a single family house. Based on the pioneering research of Robert J. Shiller and Karl E. Case, the Case-Shiller Home Price Index is generally considered the leading measure of U.S. residential real estate pricesSource: longtermtrends.net
Interpret the Sale-to-List Price Ratio?
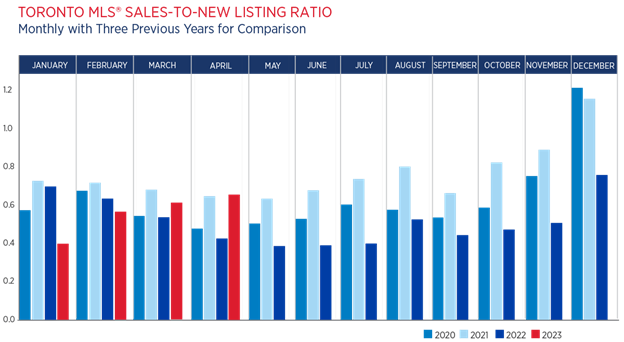
When you look at the ‘sales to new listings’ ratio over three years it is consistent from January through April. Anything above 60% is a strong ‘sellers market’. In 2022 the ratio dropped significantly after April and prices dropped as well. It is obvious that without a jump in new listings that prices will continue to rise for the balance of 2023.
RENTAL COMMENTARY

RENTAL COMMENTARY
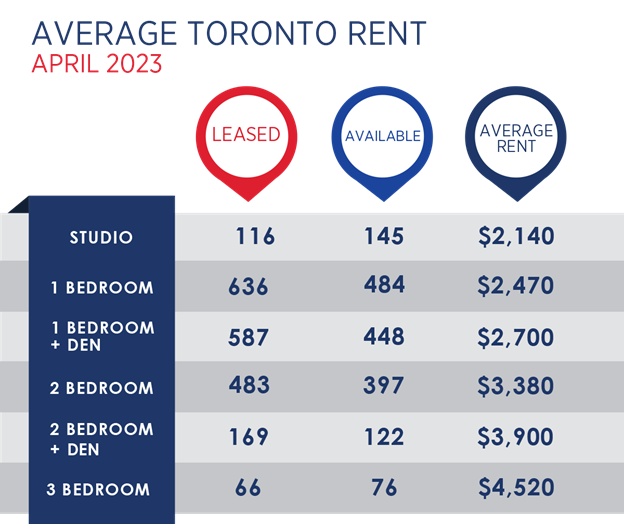
Our commentary is focused on just the Downtown and Humber Bay markets for rentals. The leasing and available units are basically unchanged in April from March at 2057 units leased. Activity in the rental market is over 3 times as busy as the sales market.The good news for tenants is that rents also have plateaued. With the construction activity downtown, many renters are giving up their cars. This month we looked at the cost of a parking spot. For a two-bedroom unit, the average rental increase for parking is $300 per month. Also 80% more units were leased with parking than without in the two-bedroom category. For investors, parking only becomes critical for larger units. But do the math. The breakeven cost for parking is about $60,000 max.

